truthfulpolitics.com

Oct 082010
 
Share

Matthew Philips in Newsweek in February 2008 mentioned the following:

  • If Texas were its own country, it would be the 48th most populous in the world
  • With a landmass of 268,000 square miles, if Texas were its own country, it would be the 40th largest
  • Furthermore, it would be the world’s eighth-largest emitter of the greenhouse gas carbon dioxide with 630 million metric tons emitted in 2005
  • In 2003, Texas emitted 670 million metric tons. Therefore, it’s emissions have reduced by 40 million metric tons
  • Texas has greater CO2 emissions than the states of California and Pennsylvania, combined. California and Pennsylvania are the second and third highest CO2 emitting states in the U.S.A.
  • Texas “residents use nearly 3,000 more kilowatt-hours of electricity every year than the average American”
  • 25% of the 20 million registered vehicles in Texas is a pickup truck. “Of the 245 million vehicles registered in the United States, only 16 percent are pickups”
  • By “some estimates more than half of all Texans live in areas where the air is unsafe to breathe, as defined by the EPA’s Clean Air Act”
  • Texas “is one of only 15 states without a climate action plan in place or even under consideration”
  • “In 2007, for the third year in a row, Texas was the nation’s leader in the amount of wind capacity added to the electric grid, as nearly $3 billion of wind-powered generators were installed in Texas”
  • The city of Austin has unveiled a Climate Protection Plan by Democratic Mayor Will Wynn. “The plan calls for 100 percent of all city facilities to be powered completely by renewable energy by 2012, and to make all new single-family homes zero-net-energy-capable by 2015, which means they’ll have to be at least 65 percent more efficient and, with solar panels on the roof, able to generate as much energy as they consume over the course of a year.”

To read the entire article, click on The CO2 State.
Oct 082010
 
Share

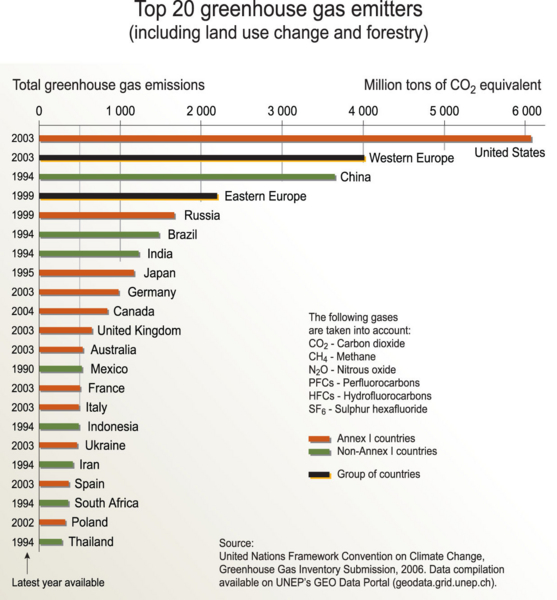
Click on the chart below to see an enlarged, clearer chart.

Largest Country CO2 Emitters

“Top 20 greenhouse gas emitters.” UNEP/GRID-Arendal Maps and Graphics Library. 2008. UNEP/GRID-Arendal. 9 Feb 2009 Top 20 greenhouse gas emitters.

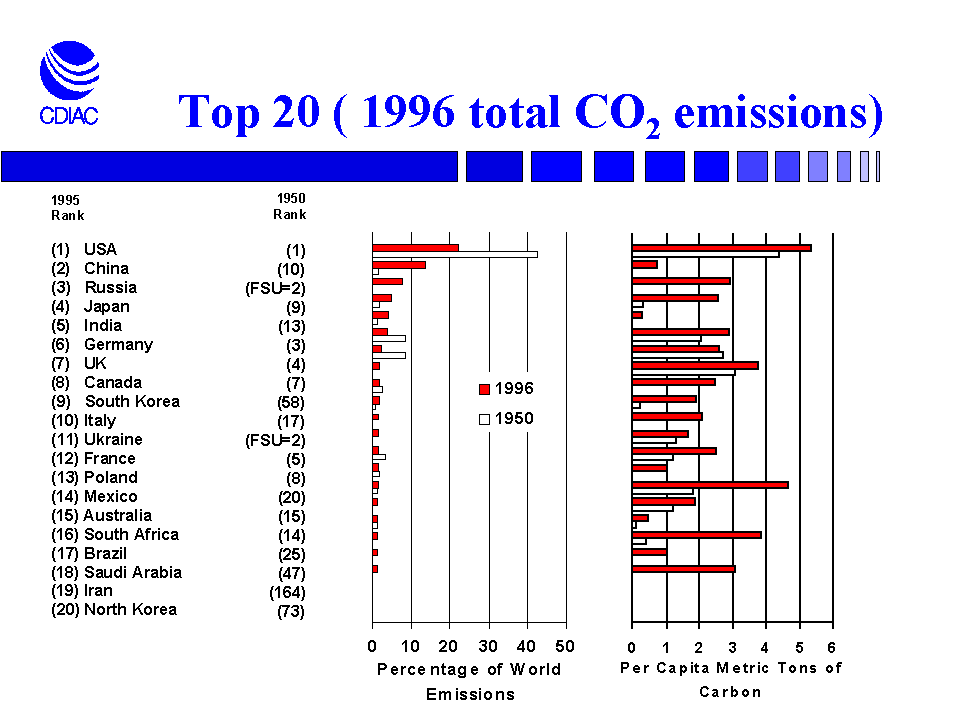
Click on the chart below to see an enlarged, clearer chart.

Largest Country CO2 Emitters

To read the entire report, click on Carbon Emissions.

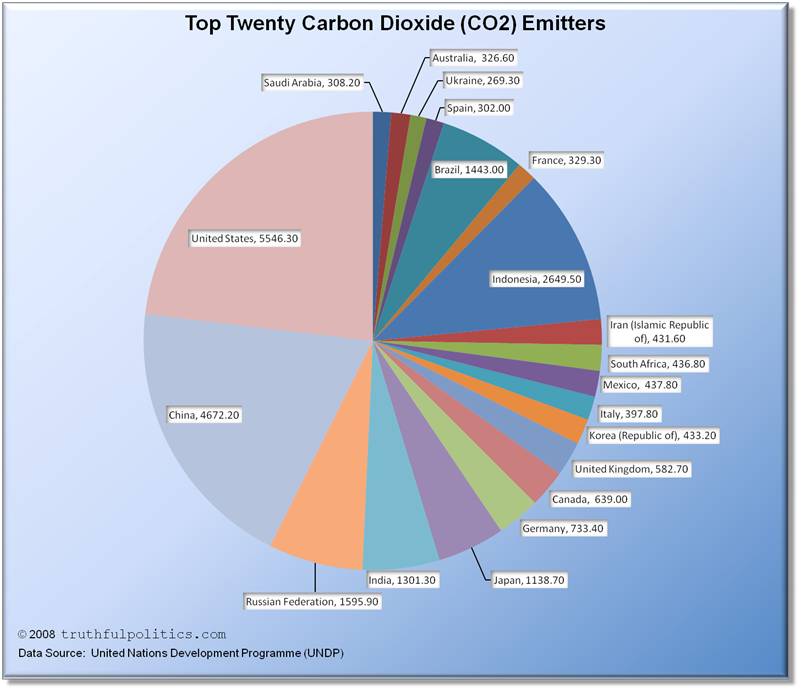
Click on the chart below to see an enlarged, clearer chart.

Largest Country CO2 Emitters

To read the entire report, click on Human Development Report 2007/2008.

Oct 082010
 
Share

A.C. Thompson and Sonya Hubbard from the Center for Investigative Reporting in April 2007 mentioned the following:

  • The oil industry lobbied against AB 32, a California anti-warming bill. The bill was eventually signed into law. Approximately $11.5 million was devoted to stop the passage of the bill.
  • The oil industry lobbied against Proposition 87. The bill would tax petroleum and transfer the money towards renewable energy. The bill did not pass. Approximately $94 million was devoted to stop the passage of the bill.

To read the entire report, click on Oil Slick.

Oct 082010
 
Share

Stanford University researchers produced a report on wind power in May 2005 mentioning the following:

  • “Wind captured at specific locations, if even partially harnessed, can generate more than enough power to satisfy the world’s energy demands”
  • “North America had the greatest wind-power potential, however, with the most consistent winds found in the Great Lakes region and from ocean breezes along coasts.”
  • Locations with sustainable, appropriate wind speed, called Class 3 winds, could produce approximately 72 terawatts. 1 terawatt equals 1 trillion watts.
  • 1 terawatt is more power than what is generated by 500 nuclear reactors, or thousands of coal-power plants.
  • The entire world’s electricity usage in 2000 was 1.6 – 1.8 terawatts.
  • The study was supported by NASA and Stanford’s Global Climate and Energy Project.

To read the entire article, click on New global wind map may lead to cheaper power supply.

Oct 082010
 
Share

Benny Peiser, member of the faculty of science at LJM University in the United Kingdom, reported the following in January of 2005 as a response to Naomi Oreskes’ Science article from January of 2005:

  • The scientific abstracts were not based on a search of the keywords “climate change,” but on the keywords “global climate change”
  • In the years 1993 to 2003, there were 1247 documents listed, not 928. Of those 1247, “only 1117 included abstracts (130 listed only titles, author(s)’ details and keywords)”
  • Of the 1117 abstracts, 13 (or 1%) explicitly endorse the scientific consensus view that climate change is beeing affected by humans
  • 322 abstracts (or 29%) implicitly accept the consensus view
  • “34 abstracts reject or doubt the view that human activities are the main drivers” of global warming over the past 50 years
  • 470 (or 42%) abstracts that included the keywords “global climate change” did not “include any direct or indirect link or reference to human activities, CO2 or greenhouse gas emissions, let alone anthropogenic forcing of recent climate change”
  • Benny Peiser concluded, “In light of the data presented above (evidence that can be easily verified), Science should withdraw Oreskes’ study and its results in order to prevent any further damage to the integrity of science.”

To read the entire article and communication, click on Dr. Benny Peiser’s Letter to Science Magazine and the Story of Its Rejection.


Zeke Hausfather wrote in October of 2007 in the Yale Forum on Climate Change and the Media that after Benny Peiser’s work was criticized by a number of climate scientists, Peiser later retracted his critique. The other climate scientists said that most of those 34 papers did not actually reject the IPCC consensus. Peiser eventually said that only one of the 34 papers had actually rejected the IPCC position. The paper was from the American Association of Petroleum Geologists Bulletin, was not peer-reviewed, and had not been included in Oreskes’ original analysis. To read the entire article, click on Upcoming Critique of Oreskes Findings on ‘Consensus’ Unlikely to Prove Convincing.

The retract referred to by Zeke Hausfather that Benny Peiser performed was also described in Media Watch, part of the Australian Broadcasting Company:

  • Peiser wrote, “Only [a] few abstracts explicitly reject or doubt the AGW (anthropogenic global warming) consensus which is why I have publicly withdrawn this point of my critique.”
  • “And when we pressed him to provide the names of the articles, he eventually conceded – there was only one:” Ad Hoc Committee on Global Climate Issues: Annual report, by Gerhard LC and Hanson BM, AAPG Bulletin 84 (4): 466-471 Apr 2000
  • AAPG stands for American Association of Petroleum Geologists

To read additional communication with Benny Peiser and Media watch, click on Media Watch.


Graham Tibbetts in The Telegraph in May 2008 reported that 31,000 scientists, 9,000 of which have Ph.D’s, have signed a petition from the Oregon Institute of Science and Medicine stating that there is no conclusive evidence that global warming is due to human activities. To read the entire article, click on Scientists sign petition denying man-made global warming.

Oct 082010
 
Share

The Statistical Assessment Service at George Mason University in April 2008 reported the following:

  • 84% percent of the 489 climate scientists surveyed personally believe human-induced warming is occurring
  • 74% of climate scientists agree that “currently available scientific evidence” substantiates its occurrence
  • 5% of climate scientists believe that human activity does not contribute to greenhouse warming

To read the entire report, click on Climate Scientists Agree on Warming, Disagree on Dangers, and Don’t Trust the Media’s Coverage of Climate Change.


Science Daily in January 2009 reported that 82% of the 3,146 scientists surveyed agreed that human activity has been a significant factor in changing mean global temperatures. To read the entire article, click on Scientists Agree Human-induced Global Warming Is Real, Survey Says.


Naomi Oreskes in Science in January 2005 reported that out of 928 scientific abstracts published between 1993 and 2003 on climate change, 75% explicitly endorsed the consensus that “Earth’s climate is being affected by human activities.” 0% of the abstracts disagreed with that consensus. To read the entire article, click on The Scientific Consensus on Climate Change.


The Intergovernmental Panel on Climate Change in 2007 said in it’s Fourth Assessment Report that “There is very high confidence that the net effect of human activities since 1750 has been one of warming.” To read the entire report, click on IPCC Fourth Assessment Report.


For beliefs of scientists against global warming, click on Beliefs of Scientists (Against Global Warming).

Oct 082010
 
Share

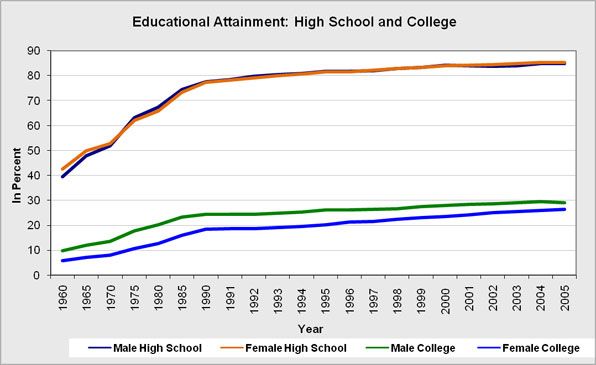
The National Center for Education Statistics made the following points about U.S. education:

  • The percentage of high school graduates that had completed advanced science coursework (i.e., at least one course classified as more challenging than general biology) increased from 35% in 1982 to 68% in 2004
  • “The percentage of high school graduates who had completed courses in advanced mathematics (i.e., completed at least one course classified as more challenging than algebra II) increased from 26 percent in 1982 to 50 percent in 2004.”
  • “The average reading scores at ages 9 and 13 were higher in 2004 than in 1971. The average score for 17-year-olds in 2004 was similar to that in 1971.”
  • Between the school years of 1995-96 and 2005-06, “mathematics SAT scores increased by 10 points, while critical reading scores decreased by 2 points.”
  • “Current expenditures for public elementary and secondary schools will be about $519 billion for the 2008-09 school year. The national average current expenditure per student is around $10,418, up from $9,154 in 2005-06.”
  • “Status dropout rates are reported for 16- through 24-year-olds. The status dropout rate for this age group declined from 15 percent in 1972 to 9 percent in 2006. A decline was also seen between 2000 and 2006, the more recent years of this time span (11 to 9 percent).”
  • “U.S. students scored lower in science literacy than their peers in 16 of the other 29 OECD jurisdictions and 6 of the 27 non-OECD jurisdictions.”
  • “In 2006, the average U.S. score in mathematics literacy was 474 on a scale from 0 to 1,000, lower than the OECD average score of 498”
  • “Among public high school students in the class of 2004-05, the averaged freshman graduation rate was 74.7 percent”

To read additional information, click on National Center for Education Statistics.